Infographics

Infographics are a visual representation of data that are displayed in a quick and easily understandable format. By using icons, imagery and graphics along with text it can enhance the audiences' understanding of the information. Being able to see trends within the data provided in a visual way.
Infographics can be used in a number of ways to show comparisons, presenting data, to explain something, raise awareness, inform consumers.
There are various different tools you can use to create elements for an infographic or the whole infographic itself.
Learn how to create an infographic in 15 easy steps here.
How to create an infographic using PowerPoint & Pixlr.com/editor

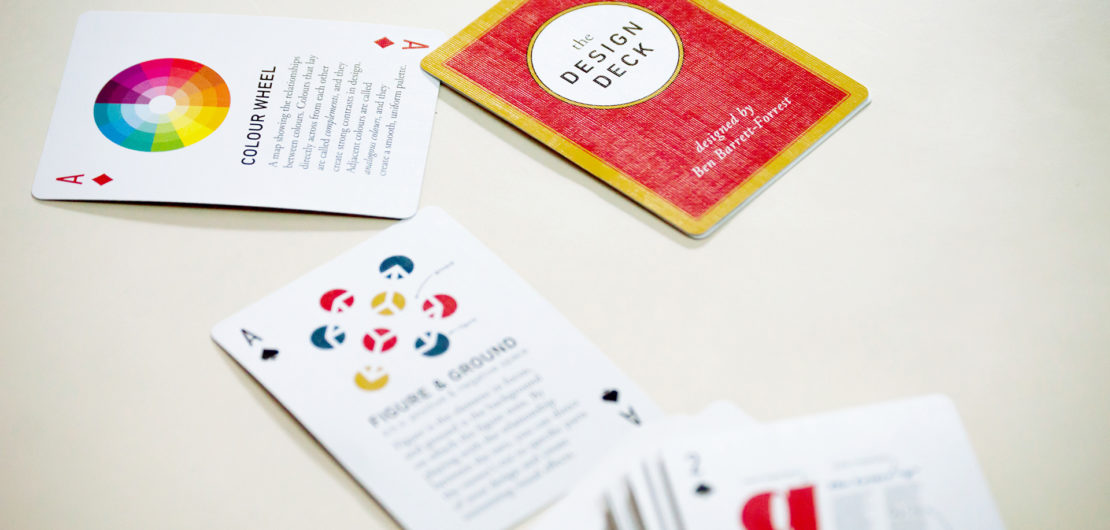
Colour Palette
Having a complimentary colour palette is important within design. This website lets you upload your images to see the colours that are included and suggests colours you could use in your design for text or other elements:
Canva's Colour Palette Generator
This website quickly generates colour schemes that you can include within your designs.
Coolors' colour Palette Generator
Both include the Hex Colour Code, which you can use in software such as Photoshop to get the exact colour required.
Learning Typography
The text you use on your posters will also have an impact on your overall design and your audience. This link provides you with tips and tutorials on choosing different typography.
Canva can also help you to find out complimentary font combinations.
Online Tools
Here are a just a few examples of online apps that will allow you to make quick and easy apps to use to create amazing designs.
Canva
Canva is an online tool to make design simple for everyone.
You can use their templates to quickly create an exciting infographic and easily change images, text and colours to match your design. Otherwise, you can create your own size blank template and add elements in.
Easel.ly
Easel.ly is a free online infographic tool to help you create great designs with its free templates which you can customise.
Picktochart
Picktochart is both an infographic and presentation app that allows you to turn boring data into something more appealing in a few simple steps. There is a free version, with paid-for version giving you more template options.
Infogram
Create engaging infographics and reports in minutes. Infogram is an intuitive visualization tool that empowers people and teams to create beautiful content.
Visme
Design and share beautiful on-brand presentations, infographics and any other visual communications. Visme is a cloud-based visual content creation and collaboration platform, empowering anyone to create professional, branded content no matter their design background; from engaging presentations and infographics to documents, videos and graphics.
Map in seconds
Allows you to paste in geographical data and it will build a map for you that can be exported to a PowerPoint file or as a PNG. So this can be a quick and easy way to add geographical visualisation into an infographic you are creating.
Visualisations
Lists several digital creative tools you can use to create visual ways to present your data, text, maps, music, history, the list goes on.
QR Codes
Adding QR codes to your document is a great way to direct your audience to another source of information. To add a QR Code you can use an online website, some examples are:
QRCode Monkey - This site allows you to alter the colour, add a logo and customise your design.
QR Code Generator - This site allows you to link to a number of different kind of sites, change the colour and upload a logo.
Copyright free
Remember to think about copyright free material when creating your infographic. You may want to add images into your final piece that you are unable to shoot yourself. However, you have got to be aware of who owns the materials and you’ll need to check the copyright on them before you use them. There are some places where you can access copyright free material, please see the links below for a few examples.
The Creative Commons are an organisation that allows people to add copyright-licences to their work. Allowing the creators to clearly define what which rights they reserve and which they waive for the benefit of the people who are wanting to use it in their work.
For more information: